 |
 |
% | region name |
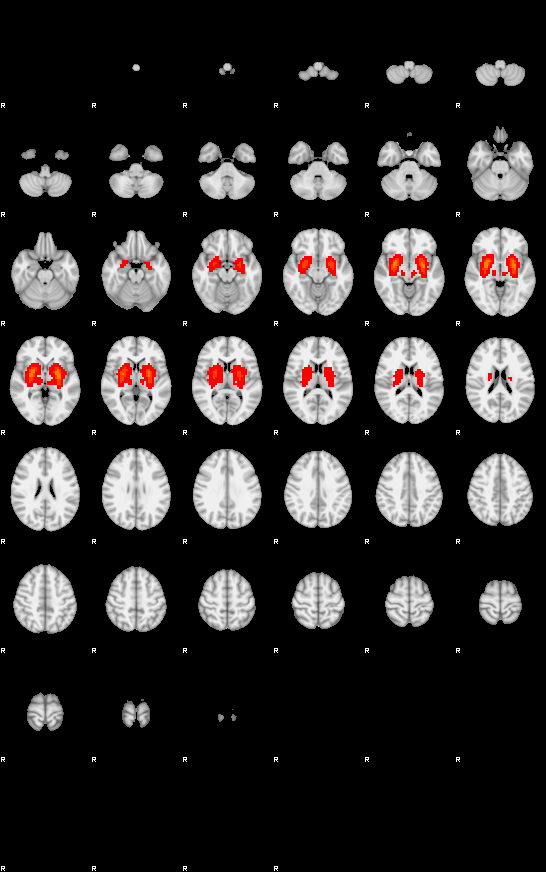
| 0.317 | Right Putamen |
| 0.299 | Left Putamen |
| 0.102 | Left Pallidum |
| 0.075 | Right Pallidum |
| 0.046 | Left Amygdala |
| 0.045 | Right Amygdala |
| 0.027 | Insular Cortex |
| 0.020 | Right Thalamus |
| 0.017 | Left Thalamus |
| 0.016 | Left Hippocampus |
| | |
| | |
| | |
| | |
| | |
| | |
Network ID: 17; Autism Frequency: 0.935; Control Frequency: 0.950; Autism>Control,pFDR-value: 0.423; Control>Autism,pFDR-value: 1.000;
Network Interactions (details): ASD Increased interactions, both: 0, temporal only: 10, spatial only: 1; ASD Increased Cluster #12; ASD Decreased interactions, both: 3, temporal only: 0, spatial only: 6; ASD Decreased Cluster #11; Sorted patient assessment scores: [link]